
 English
  Español
  Français
  Português
  Deutsch
  日本語
日本語  한국어
한국어  Türkçe
Quick answer: Do not compare stage lights by wattage or a headline lux figure. First match the measurement distance, beam or zoom angle, colour/output state, focus and effects settings, and whether the value is centre illuminance or an average. Then compare coverage, distribution and test method. A useful report identifies the exact fixture and configuration, not just a favourable number.
A photometric report should help a buyer answer a specific question: will this fixture put enough usable light on the intended area at the planned throw? It cannot answer that question with LED wattage alone. A 150 W source and a 300 W source can produce very different results after optical losses, beam concentration, colour selection and thermal control are considered.
For distributors, rental companies, theatres and integrators, the job is not to find the largest number. It is to determine whether two datasets describe comparable conditions and whether the tested configuration matches the unit being quoted.
What Is a Stage Lighting Photometric Report?
A stage lighting photometric report is a measured dataset describing how a fixture delivers visible light. Depending on the fixture and test method, it may include centre illuminance at several distances, beam and field angles, beam diameter, luminous intensity distribution, total luminous flux, colour conditions and polar or iso-illuminance diagrams.
Keep source and optical data separate:
- Source wattage describes the rated electrical power of the lamp or LED engine, not light delivered to the target.
- Fixture power includes drivers, motors, fans and electronics; it is not an output measurement.
- Lumens describe luminous flux, the total visually weighted light output.
- Candela describe luminous intensity in a stated direction.
- Lux describe illuminance on a surface: one lumen per square metre.
- Beam angle and field angle describe intensity boundaries, not an evenly bright circle.
- Throw distance is the distance used for the reading or coverage calculation.
The practical rule is simple: LED wattage does not equal usable output at the stage. A report becomes useful only when its conditions are stated.
The Photometric Numbers Buyers Should Check First
| Metric | What it measures | Why buyers should care | Common comparison mistake |
|---|---|---|---|
| Lux | Illuminance on a surface | Shows light arriving at a target under stated conditions | Comparing values measured at different distances |
| Lumens | Total luminous flux | Helps describe total output, especially for broader distributions | Treating lumens as centre brightness or coverage |
| Candela | Luminous intensity in a direction | Useful for directional output and distance calculations | Treating peak candela as uniform intensity across the beam |
| Beam angle | Normally the full angle at the 50%-of-centre-intensity points | Defines the nominal stronger central cone | Comparing centre lux from different angles |
| Field angle | The wider full angle at the 10%-of-maximum-intensity points | Helps assess outer field, blending and spill | Assuming it is a hard, uniformly lit edge |
| Zoom range | Published minimum-to-maximum optical angle | Shows coverage flexibility | Assuming every zoom position has the same output or uniformity |
| Throw distance | Fixture-to-measurement-plane distance | Gives a reference for lux and coverage | Quoting lux without distance |
| Beam diameter | Geometric or measured width at a distance | Checks whether the target fits within the nominal cone | Treating calculated diameter as uniform usable coverage |
| CCT | Correlated colour temperature of white output | Matters for camera, theatre and matching requirements | Comparing lux from different white/CCT modes without noting it |
| CRI/TLCI | Colour-rendering metrics under stated conditions | Relevant to camera and colour-critical applications | Requiring them for every effects fixture or ignoring test conditions |
Not every moving head needs every metric. A narrow aerial Beam, a colour-mixing Wash and a Profile used on camera have different evaluation priorities. The report should match the application.
Lux vs Lumens vs Candela
The CIE defines illuminance as incident luminous flux per unit area, expressed in lux. The IES defines one lux as one lumen per square metre. Lumens measure luminous flux, while candela measure luminous intensity per unit solid angle in a direction.
For purchasing, this means:
- Lumens help describe how much visually weighted light leaves a system in total.
- Candela help describe how strongly that light is directed.
- Lux tell you how much light reaches a surface at a specific geometry and distance.
Two fixtures can have similar source wattage or total lumens yet produce different centre lux. A narrow optical system concentrates intensity into a smaller solid angle. A wide Wash distributes output over a larger area. Optical efficiency, lens design, colour state, focus and thermal control also change the result.
For an approximate point source measured on-axis and perpendicular to the beam, illuminance follows E = I / d², where E is lux, I is candela and d is distance in metres. Use this as a reasonableness check, not as a replacement for measured data from the selected optical state.
How to Read a Lux-at-Distance Chart
Start with the chart heading and model number. Then read each value together with its distance, optical setting and colour/output state. “50,000 lux” is meaningless without a measurement distance and configuration.
For each row or point, ask:
- Is the value centre illuminance, an average over an area or another statistic?
- Is the target plane perpendicular to the optical axis?
- What beam or zoom angle was used?
- Was the fixture in open white, a calibrated white/CCT mode or a mixed colour?
- Were frost, iris, prism, gobo and framing functions open or inserted?
- Was output at full intensity, and which fan or power mode was active?
- Does the report identify the tested model, sample and revision?
A narrow-zoom centre reading can be valid while still being unsuitable for a broad stage wash. Conversely, a lower centre reading at a wide setting can cover the required area more effectively.
Example: Reading an AOLAIT Moving Head Lux Chart
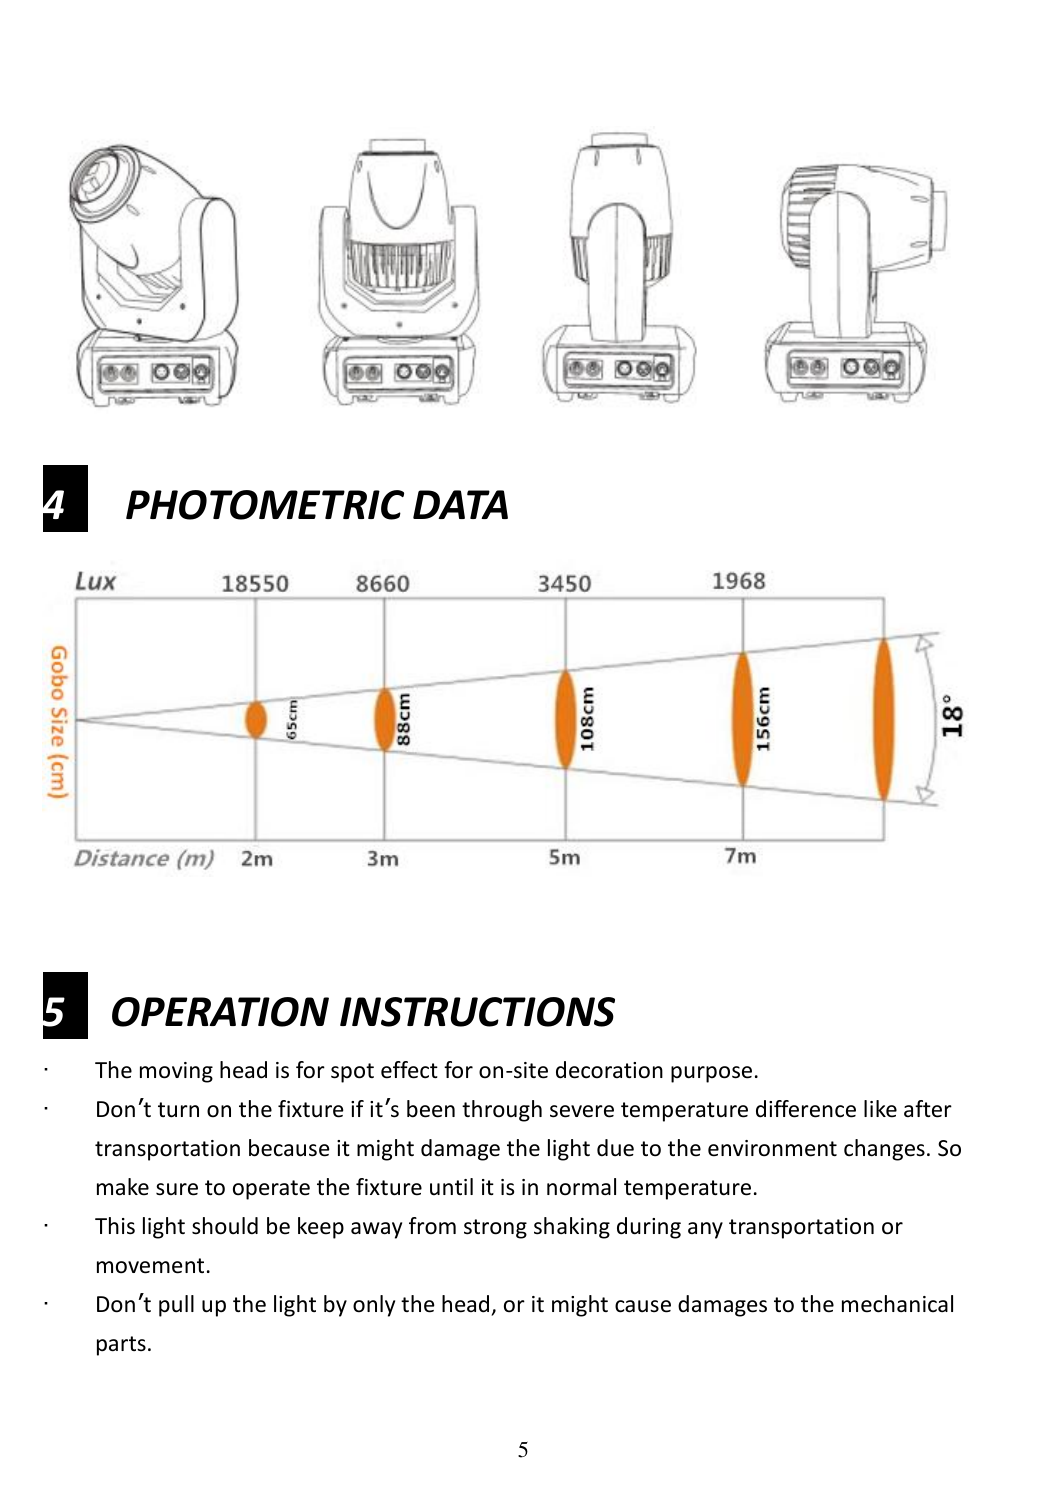
The AOLAIT AL150LS user manual publishes a white-light photometric chart for the 150 W LED Spot moving head. These are published measurements, not calculated values:
| Distance | Published centre illuminance | Published condition | What a buyer can conclude |
|---|---|---|---|
| 2 m | 18,550 lux | White light | Short-throw centre reading for this documented sample/configuration |
| 3 m | 8,660 lux | White light | Output falls as distance increases |
| 5 m | 3,450 lux | White light | Direct reference for a 5 m comparison under matching conditions |
| 7 m | 1,968 lux | White light | A longer-throw reference, still specific to the chart conditions |
The values are useful because the chart names multiple distances and the manual identifies white light. They do not establish average illuminance, uniformity, coloured-output performance or the result with a gobo or prism inserted. They should not be extrapolated and presented as additional AOLAIT measurements.
The manual also contains an internal optical discrepancy: its feature list states a 15° beam angle, while the photometric diagram marks 18°. Buyers should request a current clarification before using either angle for a final coverage plan. This article therefore does not combine the chart’s lux values with either disputed angle.
View the current AL150LS product page or download the published AL150LS manual.
Why Beam Angle Changes the Lux Number
A narrower beam normally concentrates luminous intensity into a smaller projected area. A wider beam spreads output across a larger area. At the same distance, the narrow setting may therefore show much higher centre lux even when the wide setting is more useful for the application.
Higher lux does not automatically mean a better fixture when angles differ. A 3° Beam and a 40° Wash solve different jobs. Compare output only after matching the angle or after explicitly accounting for the different coverage.
Use the fixture role to choose the evidence that matters: compare centre intensity and long-throw consistency in the Beam Moving Head range, zoom and field uniformity in the Wash Moving Head range, shaping and edge quality in Profile and Framing models, and mode-specific data for Beam Spot Wash Hybrids.
For the angle definitions and coverage geometry, use the dedicated Beam Angle vs Field Angle guide when it is published. Until that URL is live, keep the distinction inside the current evaluation rather than creating a broken link.
Calculate Approximate Beam Diameter at a Given Throw Distance
For a symmetrical cone projected perpendicular to a flat target:
Beam diameter ≈ 2 × distance × tan(angle / 2)
This is a geometric approximation. Distance and diameter must use the same unit, and the angle is the full included angle. The values below were calculated programmatically and rounded to two decimal places.
| Full angle | 5 m throw | 10 m throw | 15 m throw | 20 m throw |
|---|---|---|---|---|
| 3° | 0.26 m | 0.52 m | 0.79 m | 1.05 m |
| 10° | 0.87 m | 1.75 m | 2.62 m | 3.50 m |
| 20° | 1.76 m | 3.53 m | 5.29 m | 7.05 m |
| 40° | 3.64 m | 7.28 m | 10.92 m | 14.56 m |
This calculation does not predict uniformity, edge intensity, spill, focus quality or colour consistency. If the target is angled, the projected shape becomes elliptical and one circular diameter is insufficient.
Beam Angle vs Field Angle in a Photometric Report
The CIE definition of beam angle uses points where luminous intensity is 50% of centre beam intensity; it is a full angle, not a half-angle. The IES field-angle definition uses the wider directions where intensity is 10% of maximum.
Manufacturers and product categories do not always use the terms consistently. Before comparing reports, determine:
- which threshold defines the published angle;
- whether the number is a full angle;
- whether horizontal and vertical angles differ;
- whether the reported centre is also the distribution maximum;
- whether a generic “beam angle” is actually a zoom range or another convention.
Neither boundary is a uniformly bright edge. A polar curve or iso-illuminance diagram reveals more about the distribution between centre and field.
Why You Cannot Compare Two Lux Charts Without Matching Test Conditions
Consider Fixture A measured at a narrow angle and Fixture B measured at a wide angle. Fixture A may produce a much higher centre reading because it concentrates light into a small area. Fixture B may provide the coverage the stage actually needs. Ranking them by raw centre lux alone would reward concentration, not suitability.
Normalize or verify the following before comparing:
- the same measurement distance;
- the same beam/zoom angle or equivalent coverage;
- the same white, CCT or colour-output state;
- the same focus, frost, iris, prism, gobo and framing state;
- comparable power, fan and output modes;
- the same type of value, such as centre versus average illuminance;
- comparable target geometry and measurement method.
When one report gives only a single favourable point, request the missing configuration and distribution evidence. Do not estimate missing measured data and present it as a supplier result.
Common Red Flags in Supplier Photometric Data
- A lux figure with no distance.
- A distance with no beam or zoom setting.
- Wattage presented as if it were measured output.
- A lumen claim with no method or configuration.
- Centre lux described as overall brightness or uniform coverage.
- Only one unusually favourable data point.
- No colour/output mode or effects state.
- No beam distribution or definition of the reported angle.
- Product page and manual values that conflict.
- No report date, model version or tested configuration.
- A chart that cannot be traced to the exact fixture being quoted.
These are verification issues, not proof of misconduct. Ask for clarification and record the answer in the quotation or technical submittal.
What to Ask a Stage Lighting Manufacturer Before Comparing Fixtures
- What was the measurement distance?
- What beam or zoom angle was used, and how was that angle defined?
- Is the value centre illuminance, average illuminance or another measurement?
- Which white, CCT, colour or colour-wheel position was used?
- Were frost, iris, gobo, prism and framing functions open?
- Was the fixture at full output, and which operating mode was active?
- What instrument and test method were used?
- Is a polar curve, iso-illuminance chart or beam distribution available?
- Is an IES, LDT or other photometric file available for this application?
- Which production model, optical configuration and report revision were tested?
- Can the supplier provide data at the project’s actual throw and target size?
IES files can contain luminous-intensity distribution data and test details for lighting calculations, but not every stage-effects fixture is supplied with one. Request the evidence appropriate to the fixture and project rather than treating a specific file format as a universal requirement.
Frequently Asked Questions
What is a photometric report in stage lighting?
It is measured or documented optical data describing how a fixture delivers light. Useful reports identify the model, configuration, distance, angle, output state and type of measurement.
Is lux more important than lumens for moving heads?
Neither replaces the other. Lux is directly relevant to light arriving at a target; lumens describe total flux. A buyer also needs angle and distribution to understand coverage.
At what distance should a moving head lux value be measured?
There is no single distance for every fixture. The report should include distances relevant to the fixture’s role, and the buyer should prioritise the planned project throw.
Why does lux decrease as throw distance increases?
For an approximate point source, illuminance decreases with the square of distance. Real fixtures can deviate because of near-field geometry, focus, zoom and measurement conditions.
Can I compare lux values from two different beam angles?
Not as a simple brightness ranking. Different angles cover different areas. Match angle or coverage and all other test conditions first.
What is the difference between beam angle and field angle?
Beam angle normally uses the 50%-intensity boundary. Field angle uses the wider 10%-intensity boundary. Confirm the manufacturer’s definition.
Does higher wattage mean higher stage-light output?
No. Wattage does not account for optical efficiency, distribution, colour state, thermal control or light reaching the target.
What photometric data should I request from a manufacturer?
Request lux at relevant distances, angle definitions, zoom and colour conditions, effects state, distribution data, test method, model/revision identification and the available photometric file or report.
Comparing Photometric Data for a Project?
Send AOLAIT the fixture type, venue/application, throw distance, target beam or coverage, required illuminance if known, indoor/outdoor requirement and quantity. Request suitable fixture options, current optical specifications, available photometric data and a quotation.